Practical Use of Fil to Improve Python Memory Usage
Posted on Nov 29, 2021 in Python Programming - Advanced Level by Amo Chen ‐ 4 min read
In the post Identifying Peak Memory Usage with Python’s Resource Module, we showed how to use the Python resource module to identify peak memory usage. However, this module doesn’t provide detailed memory stats nor does it show which parts of your Python code consume the most memory. Therefore, we need a tool to profile memory usage in detail to help pinpoint problems.
In this post, we’ll introduce how to use Fil to profile Python programs’ memory usage. We’ll go through a simple example to identify and optimize the parts of the program that consume the most memory.
Environment
- macOS 11.6
- Python 3.7
- pandas 1.0.3
- Fil
$ pip install pandas==1.0.3 filprofiler
Test Data
We will use the following dataset for testing. It includes a CSV file of financial news over 200MB. We will use this data to simulate memory consumption when processing large amounts of data:
Daily Financial News for 6000+ Stocks
Fil (aka Fil profiler)
Fil is a very user-friendly memory profiling tool for Python. Its working principle involves using the operating system’s LD_PRELOAD / DYLD_INSERT_LIBRARIES mechanism to load a developer-specified shared library before a program starts. This library can override certain key system APIs, allowing developers to intercept some API calls, such as Fil overriding memory-related APIs, to intercept and track memory allocation and usage, thus achieving memory profiling.
If you want to know which APIs Fil intercepts, refer to the article What Fil tracks.
Getting Started with Fil
The example below loads the raw_partner_headlines.csv from our test dataset, checks how many headlines mention J.P. Morgan, and counts the number of times the mentioned stock codes appear. The results only display stock codes appearing more than 5 times:
import pandas as pd

def load_data():
    return pd.read_csv('<path to>/raw_partner_headlines.csv')

def main():
    df = load_data()
    df = df.query('headline.str.contains("J.P. Morgan")', engine='python')
    df = df.groupby(by='stock').count()
    for r in df.sort_values(by='headline', ascending=False).itertuples():
        if r.url > 5:
            print(r.Index, r.url)

main()
Running the example results in the following output, showing the most mentioned stock codes by J.P. Morgan, led by JPM followed by ARNA:
$ python test.py
JPM 15
ARNA 10
ZIOP 8
BMRN 8
AVEO 8
TEX 6
MDVN 6
NKTR 6
REGN 6
VVUS 6
Next, we will use Fil to profile the memory usage of the above example. The following command profiles the memory usage of test.py:
$ fil-profile run test.py
=fil-profile= Memory usage will be written out at exit, and opened automatically in a browser.
...(output omitted)...
Once fil-profile completes memory profiling, Fil opens a browser window with the analysis report presented as a webpage:
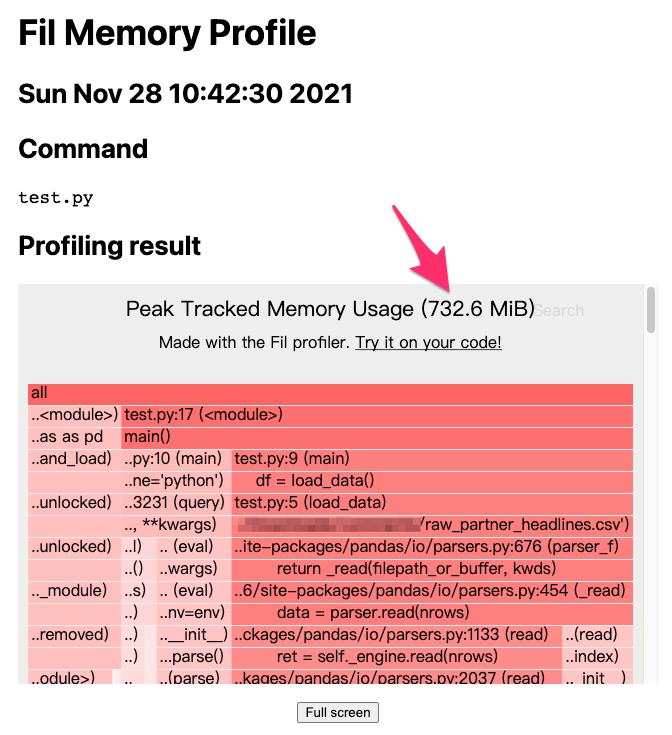
The figure above shows that the example used 732.6 MiB of memory, nearly double the 400MB size of the raw_partner_headlines.csv file. Ideally, loading the data would occupy only 400MB, but due to Python’s object-oriented design, such memory usage is expected. The larger the raw_partner_headlines.csv file, the larger the machine required for processing, inevitably affecting costs (e.g., machine rental costs). Thus, we need to optimize memory usage.
Following the report, we can pinpoint the memory usage culprits:
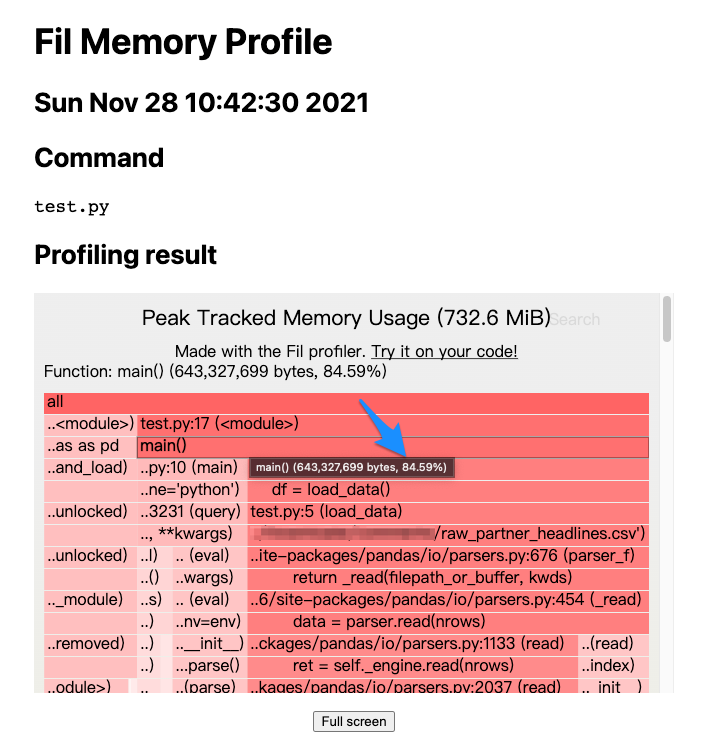
The chart shows that the main() function accounts for about 84.59% of memory usage. We can dive deeper into which part of the main() function is consuming so much:
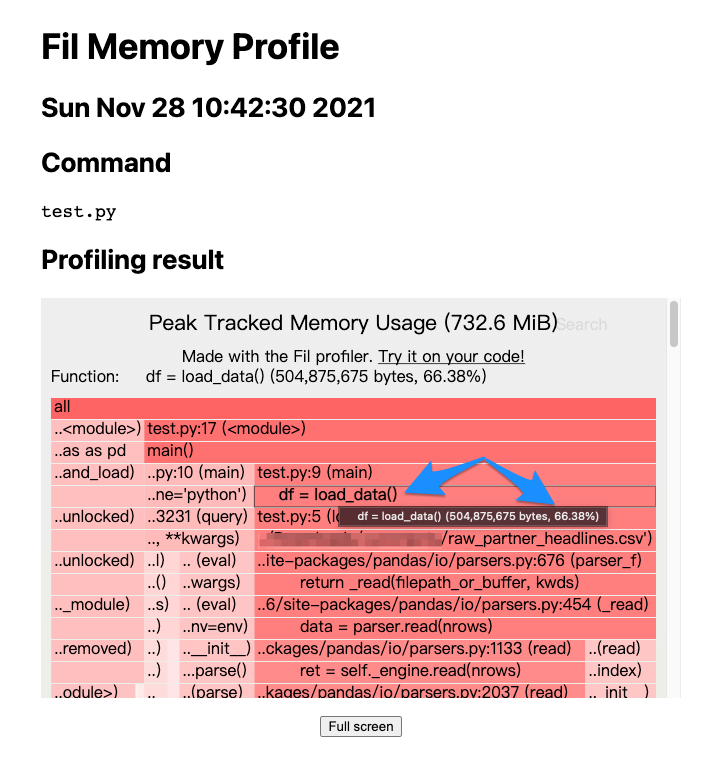
The indicated function, load_data(), takes up about 66.38% of memory usage, so optimizing load_data() may be a viable direction.
Real-world Optimization
The default behavior of pandas.read_csv() loads the entire file into memory. Loading data in chunks can reduce memory usage significantly. Thus, you can set the chunksize parameter in read_csv() for batch processing. The downside is that you cannot compute the final result at once and need to sum and store the results from each batch, as shown in the counter[r.Index] += r.url part of the example below. Finally, you print the summed results:
import pandas as pd
from collections import Counter

def load_data():
    return pd.read_csv(
        '<path to>/raw_partner_headlines.csv',
        chunksize=1000
    )

def main():
    counter = Counter()
    for df in load_data():
        df = df.query('headline.str.contains("J.P. Morgan")', engine='python')
        df = df.groupby(by='stock').count()
        for r in df.itertuples():
            counter[r.Index] += r.url

    for stock, count in counter.items():
        if count > 5:
            print(stock, count)

main()
The above example yields the following output:
$ python test.py
ARNA 10
AVEO 8
BMRN 8
JPM 15
MDVN 6
NKTR 6
REGN 6
TEX 6
VVUS 6
ZIOP 8
And its memory profiling report is as follows:
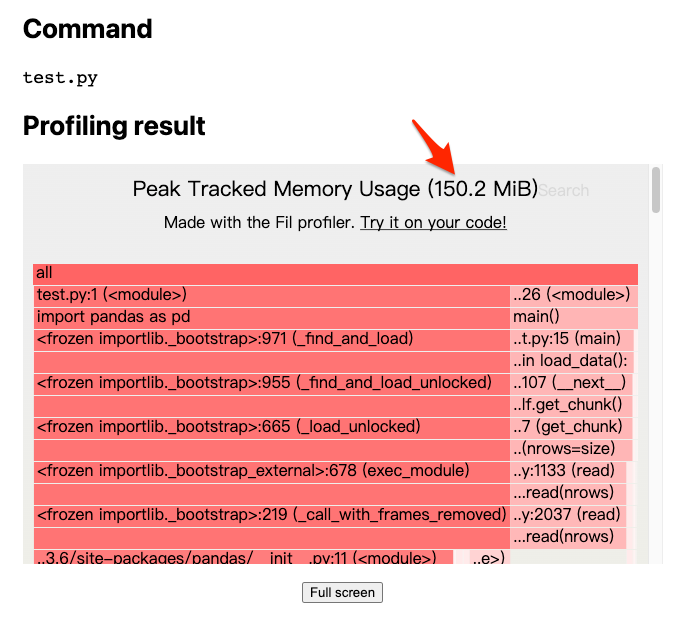
The report shows that simply adding a parameter reduced memory usage from 732.6 MiB to 150.2 MiB, a significant decrease. This approach eases memory concerns when handling larger data volumes and allows for the use of lower specification machines if renting cloud servers.
That’s the process of using Fil to improve memory usage in practice.
Happy coding!
References
https://pythonspeed.com/fil/docs/index.html