Practical Python Performance Profiling - From cProfile to py-spy
Posted on Dec 9, 2021 in Python Programming - Advanced Level by Amo Chen ‐ 6 min read
It’s a well-known fact that Python applications run slower compared to those written in languages like Go or C. However, Python’s ease of use significantly speeds up development, and its philosophy of batteries included along with its rich ecosystem can greatly reduce the need to reinvent the wheel, shortening the path from concept to product.
The issue of slower execution can be mitigated through various techniques such as using distributed systems, multithreading, multiprocessing, optimizing algorithms, or extending Python with more efficient languages (e.g., using the ctypes module). Although it might not achieve the same high efficiency as Go or C, it can certainly reach an acceptable level of performance.
Before tackling real efficiency issues, it’s often the case that inefficiencies are due to poorly written Python applications rather than limitations of Python itself.
Analyzing Python code to find hidden performance issues is crucial. This article starts by introducing the cProfile module and demonstrates with examples how to identify bottlenecks in Python programs. We then use the py-spy tool to precisely locate issues, improving the efficiency of finding problems.
Environment
$ pip install pandas==1.0.3 snakeviz py-spy
Dataset
The example in this article uses the following dataset:
Daily Financial News for 6000+ Stocks
Example Program
Here’s the example program. It loads the raw_partner_headlines.csv file from the dataset, counts the occurrence of US stock symbols with the phrase To New High in the headline field, and finally prints symbols that appear more than 5 times in descending order.
import re
import pandas as pd

from collections import Counter


def load_data():
    return pd.read_csv(
        '<path to>/raw_partner_headlines.csv',
        chunksize=100
    )


def main():
    counter = Counter()
    for df in load_data():
        for r in df.itertuples():
            if re.search(r'To New High', r.headline):
                counter[r.stock] += 1

    for stock, count in sorted(
        counter.items(),
        key=lambda x: x[1],
        reverse=True
    ):
        if count >= 5:
            print(stock, count)


main()
Output upon execution of the above program is approximately:
$ time python test.py
ULTA 9
ALK 5
YY 5
python test.py  70.01s user 7.17s system 100% cpu 1:17.00 total
cProfile Module
cProfile is a built-in Python module for performance profiling. It provides two main profiling interfaces:
The difference between these two lies in their implementation. cProfile is a C-implemented Python extension, suitable for profiling longer-running Python programs. It’s more performant and is the recommended method by Python’s official documentation. On the other hand, profile is a Python-implemented module and is less efficient, generally not recommended.
Using cProfile is quite straightforward, you simply add -m cProfile while running a Python command.
For example, to profile the previously mentioned example program:
$ python -m cProfile test.py
This command will produce a detailed performance report at the end:
...
         126019093 function calls (124921197 primitive calls) in 111.419 seconds

   Ordered by: standard name

   ncalls  tottime  percall  cumtime  percall filename:lineno(function)
        1    0.000    0.000    0.000    0.000 <__array_function__ internals>:2(<module>)
   110737    0.102    0.000    0.380    0.000 <__array_function__ internals>:2(concatenate)
The report highlights six key points:
- Total execution time: 111.419 seconds
- Sorted by standard name, which refers to filename:lineno(function)
- Number of calls to each function, indicated by
ncalls - Total time spent on each function (excluding time spent in sub-calls),
tottime - Cumulative time spent (including sub-calls),
cumtime - Two percall values represent
tottimeandcumtimeeach divided byncalls, showing average time per call
The default sorting usually doesn’t reveal issues instantly, so we often change the sorting order to cumulative time. Functions with the longest cumulative times are typically bottlenecks worth investigating:
$ python -m cProfile -s cumulative test.py | less
This command adds -s cumulative to sort by cumtime in descending order. For more sorting options, refer to the official documentation.
...
         126019099 function calls (124921203 primitive calls) in 112.626 seconds

   Ordered by: cumulative time

   ncalls  tottime  percall  cumtime  percall filename:lineno(function)
  19157/1    7.448    0.000  113.576  113.576 {built-in method builtins.exec}
        1    0.000    0.000  113.576  113.576 test.py:1(<module>)
        1    2.707    2.707  113.179  113.179 test.py:14(main)
    18457    0.022    0.000   82.398    0.004 parsers.py:1105(__next__)
    18457    0.089    0.000   82.376    0.004 parsers.py:1160(get_chunk)
    18457    0.217    0.000   82.287    0.004 parsers.py:1131(read)
    18456    0.141    0.000   44.636    0.002 frame.py:414(__init__)
    18456    0.181    0.000   44.408    0.002 construction.py:213(init_dict)
    18457    0.259    0.000   36.784    0.002 parsers.py:2035(read)
    18457   28.631    0.002   35.912    0.002 {method 'read' of 'pandas._libs.parsers.TextReader' objects}
Reading such long text reports can be cumbersome, so SNAKEVIZ is recommended for a visual representation. We can use commands to export this text report to a file using the -o option:
$ python -m cProfile -o test.prof test.py
Then use snakeviz to open it:
$ snakeviz test.prof
This command will open the browser displaying a chart:
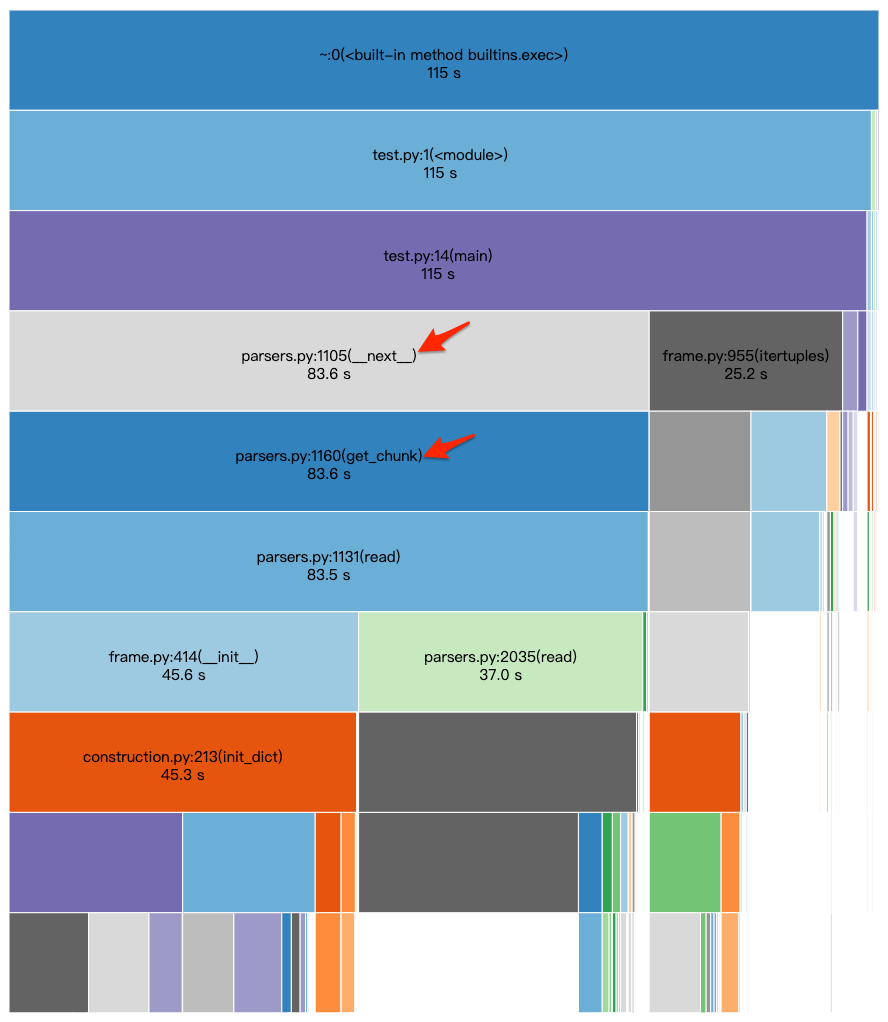
From this chart, parsers.py:1105(__next__) takes about 83.6 seconds, which accounts for approximately 72% of the main() execution time at 115 seconds. The __next__ method, likely called by Python loops, further calls get_chunk. Hence, the cumtime of get_chunk matches closely with __next__.
These clues suggest that the for loop in the code might be the time-consuming part. Investigation into get_chunk reveals that its ncalls is 18457. Although percall is only 0.004 seconds, the high call count impacts execution time. Reducing ncalls effectively shortens execution time.

Investigating get_chunk, it’s likely that the small chunksize=100 setting is the cause. Let’s try adjusting chunksize to 1000:
import re
import pandas as pd

from collections import Counter


def load_data():
    return pd.read_csv(
        '<path to>/raw_partner_headlines.csv',
        chunksize=1000
    )


def main():
    counter = Counter()
    for df in load_data():
        for r in df.itertuples():
            if re.search(r'To New High', r.headline):
                counter[r.stock] += 1

    for stock, count in sorted(
        counter.items(),
        key=lambda x: x[1],
        reverse=True
    ):
        if count >= 5:
            print(stock, count)


main()
Let’s repeat the profiling process and check if the execution time decreases:
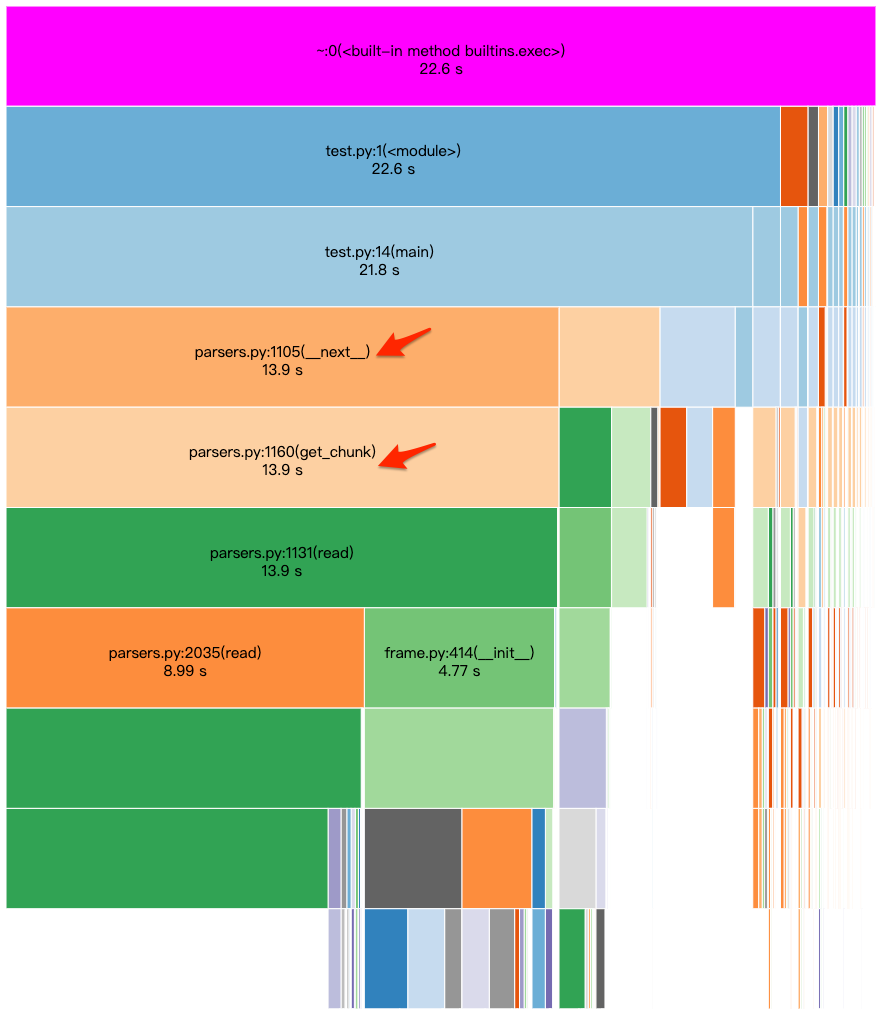
With chunksize set to 1000, the execution time drops to 22.6 seconds. The for loop now takes 13.9 seconds. Looking further into ncalls, we see it reduced to 1847 calls:

Up to this point, we find that cProfile helps identify performance issues at the function level, but pinpointing specific lines still requires some experience. Tools like py-spy, which provide line-by-line analysis, can help achieve more precise results.
py-spy
py-spy is a mature sampling profiler. It samples a program about 100 times per second by default. It works by probing Python’s memory to find out what the interpreter does at each sample point from the call stack. Parts that take longer to execute are sampled more frequently.
Besides supporting thread profiling, py-spy also profiles multiprocessing and can examine running Python processes. For more on py-spy, refer to the official documentation.
Here’s how to use py-spy to profile the example program and output results to profile.svg:
$ sudo py-spy record -o profile.svg -- python test.py
Password:
py-spy> Sampling process 100 times a second. Press Control-C to exit.
...
Note: macOS requires sudo for execution.
After running the command, the browser will open displaying a flame graph:
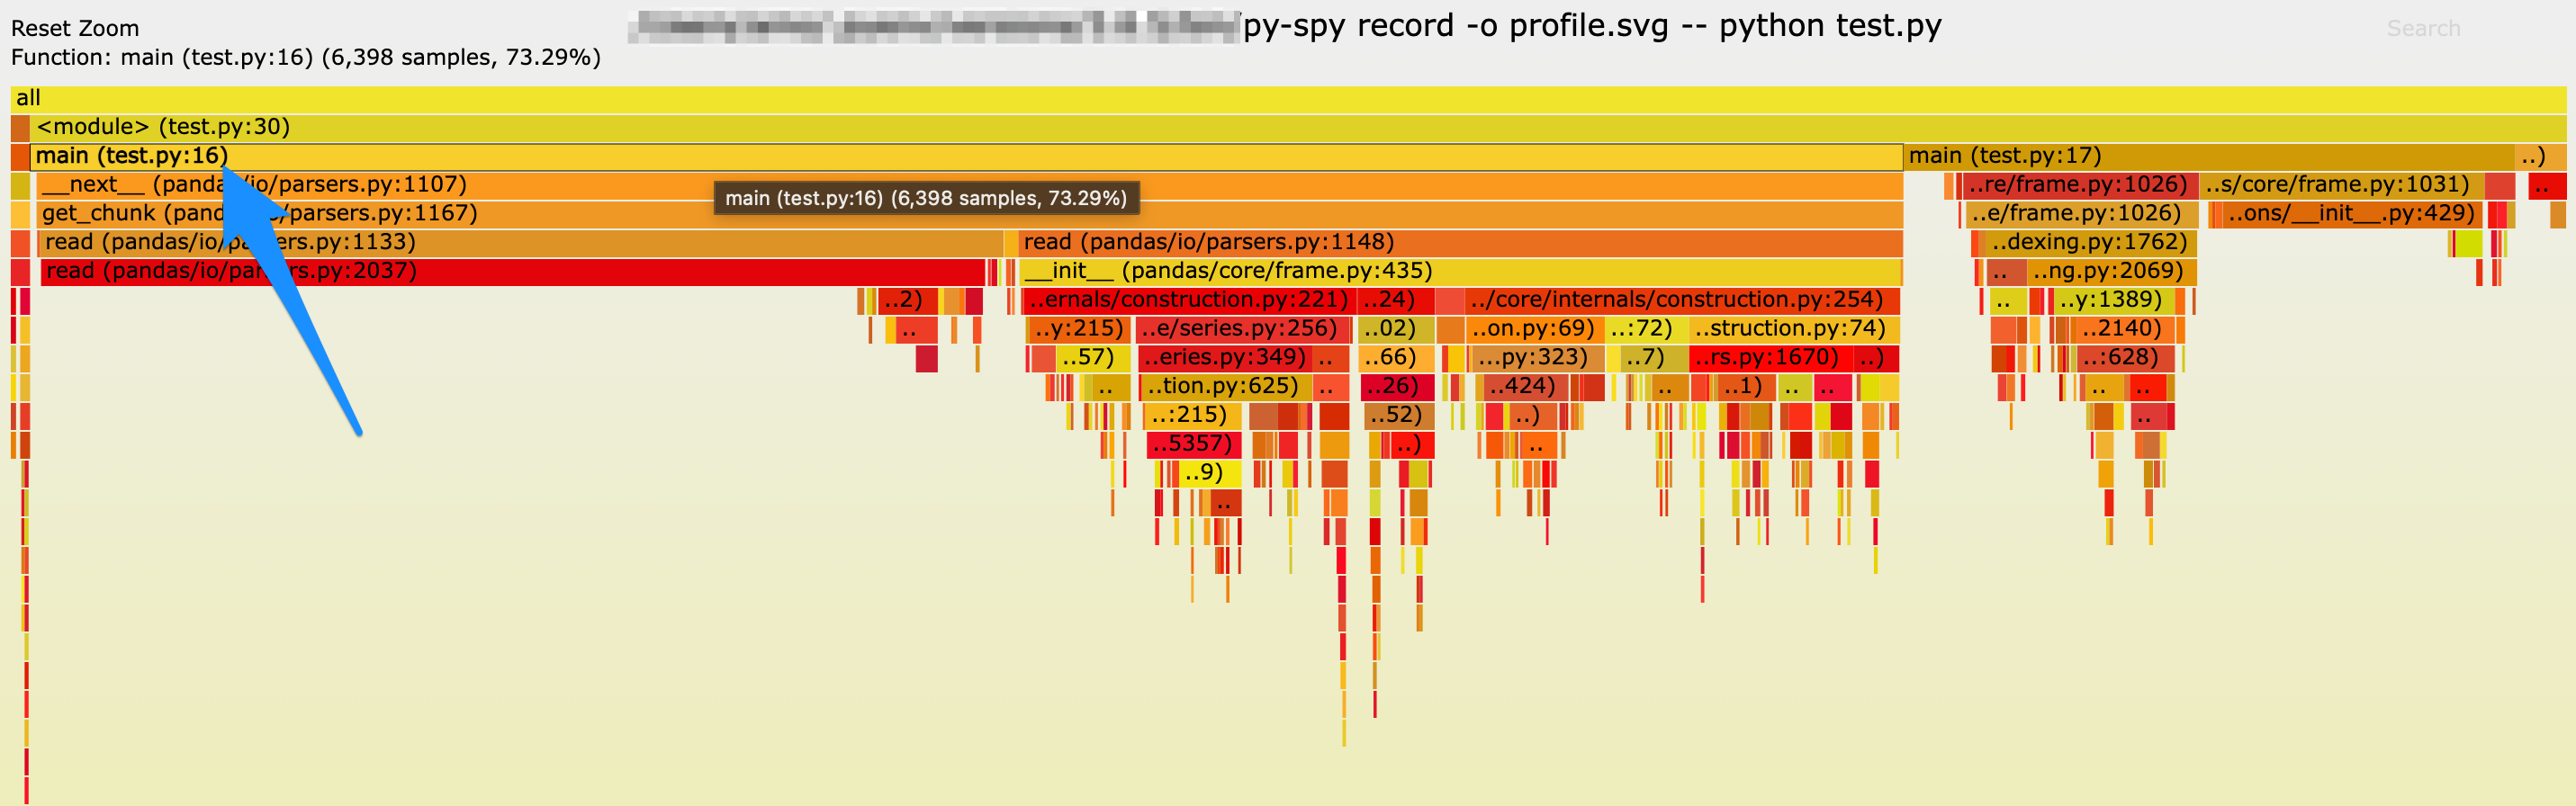
From this graph, the blue arrow points to line 16 of test.py, which takes up most of the execution time. Line 16 is precisely where the for loop is, providing a clearer insight compared to cProfile’s analysis.
Conclusion
Though cProfile has limitations, it’s a built-in module that doesn’t require additional package installations. It’s an excellent starting point for learning Python performance analysis, and understanding its principles will make other tools easier to master.
In practice, performance analysis and improvement are often more complex. This article’s example is simplified for illustrative purposes and is meant to guide. Ultimately, skill in performance analysis and improvement comes from experience and practice.
Happy coding!
References
https://docs.python.org/3/library/profile.html
https://github.com/benfred/py-spy